Curve protocol was exploited on Sunday evenin putting at risk between $50 and $100 million of user funds locked in various stablepools (alETH/msETH/pETH) using Vyper 0.2.15. The reason is thought to be a malfunctioning reentrancy lock The exploit resulted in a sharp drop in the Total Value Locked (TVL) across multiple DeFi protocols mainly Curve which registered a 48 percent decline on a weekly basis. AAVE and Convex were also severely affected as users decided to temporarily step away from using their services.
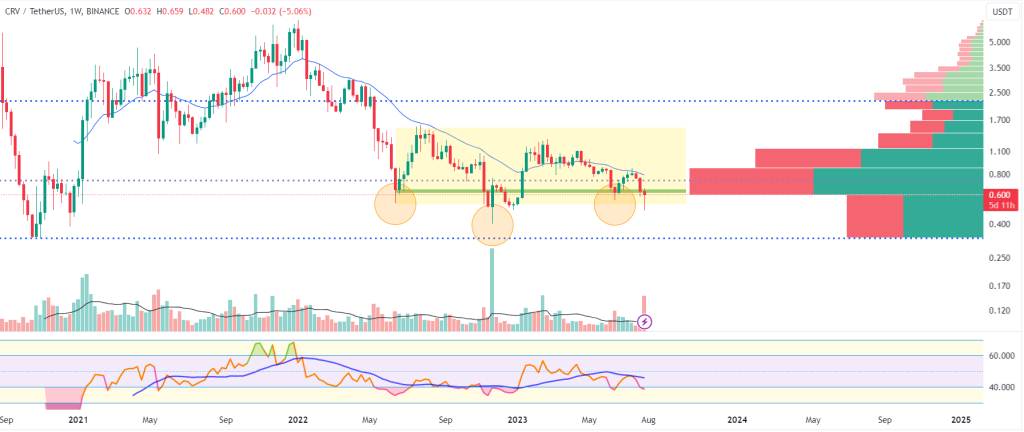
As for CRV itself, it revisited its range low versus USDT last night European time before bouncing back up from the support area. As discussed few weeks ago, it is usually when swing buyers are entering.
The formed low was once swept then touched briefly before the price reversed aggressively. It is also visible how the Volume Profile indicator’s most actively traded zone on the 1-week chart is right around the demand area. Buyers are prevailing there. The RSI indicator is entering the oversold area. Looking from the other perspective though, we can clearly see a Lower High after Lower High being built on the screen and right below the 21-EMA on the Weekly timeframe. BTC’s disappointing performance recently does not favor an altcoin market rally.
BTC and ETH dissapoint
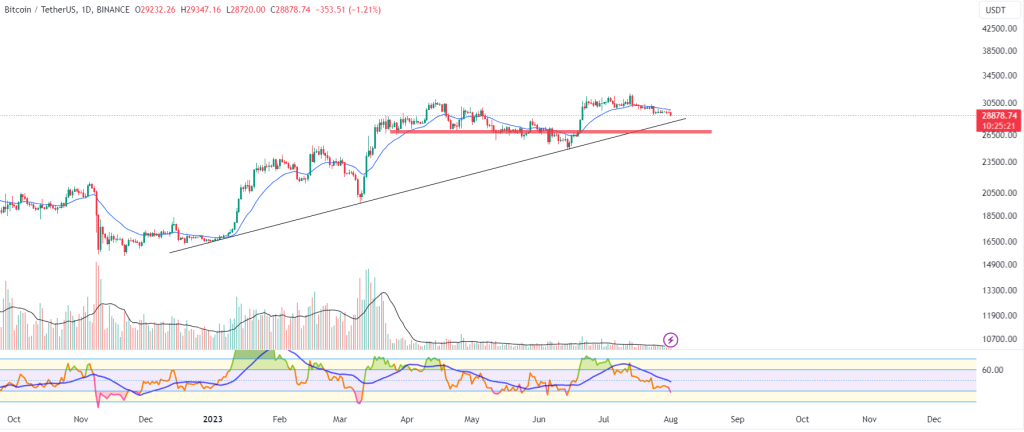
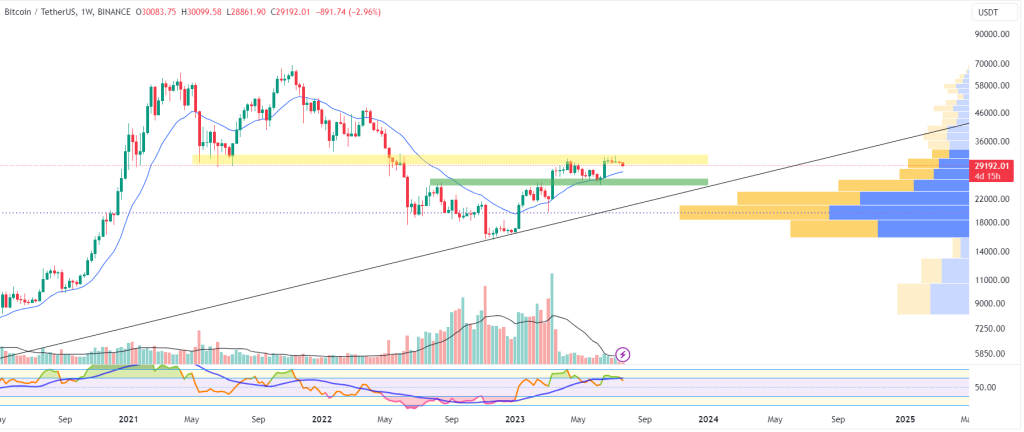
Bitcoin bulls finally gave up the fight to regain positions in the former $29,500 – $31,500 range and we can see the price slipping towards either the daily chart uptrend diagonal or the formed support/resistance area formed around the $27,000- 27,200 mark. The area was acting as a magnet for the BTC price in the March-June period.
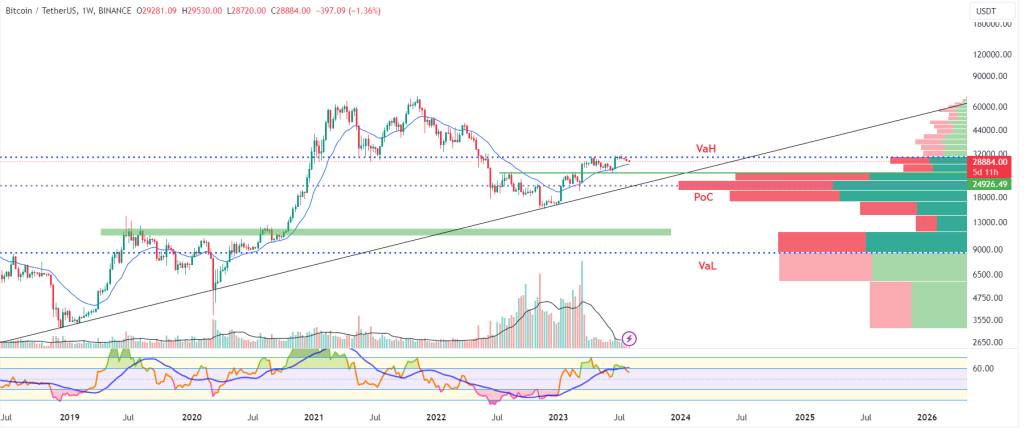
Zooming out to the Weekly timeframe chart, the most probably zone of support for bulls might be situated somewhere between $25,000 (former weekly highs) and $20,000. The long-term diagonal support line is crucial in defending the bulls’ dreams for an UP ONLY season.
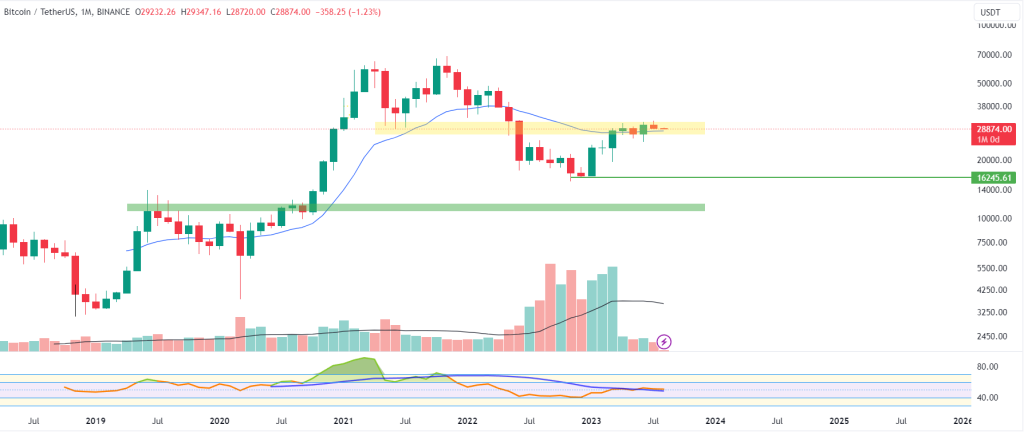
The monthly close and the price action on the 1M timeframe does not tell us much. What is clear is that there is a narrow range being formed above the fast EMA while BTC is still not giving up the formed $27,000 low.
The clear fact, though, is that overall liquidity in the market is low and every significant event is hitting particularly bad the altcoin market while BTC remains relatively stable.
ETH
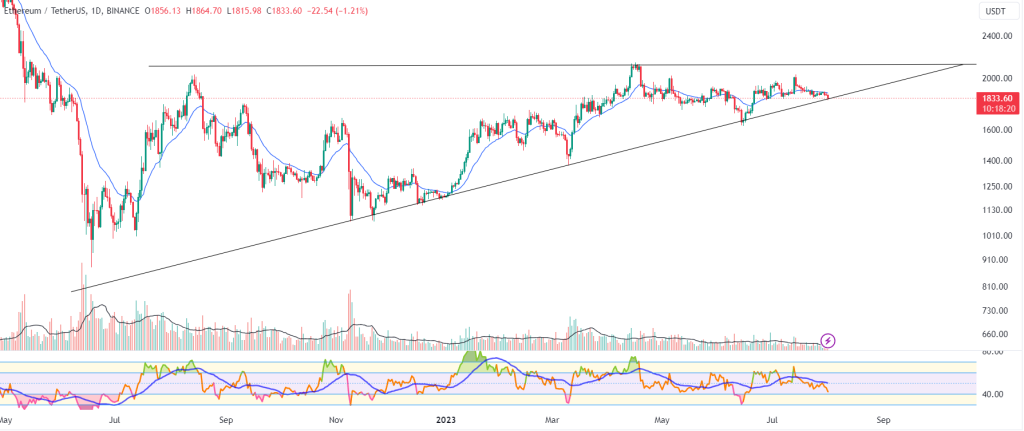
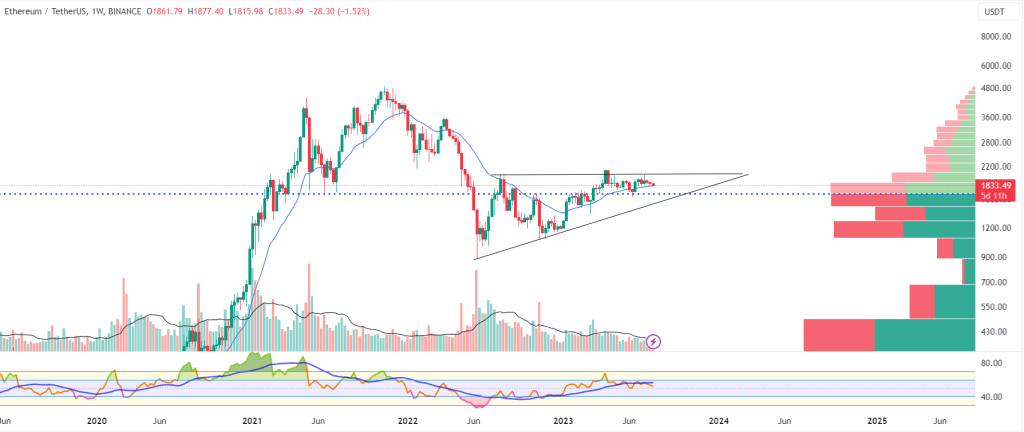
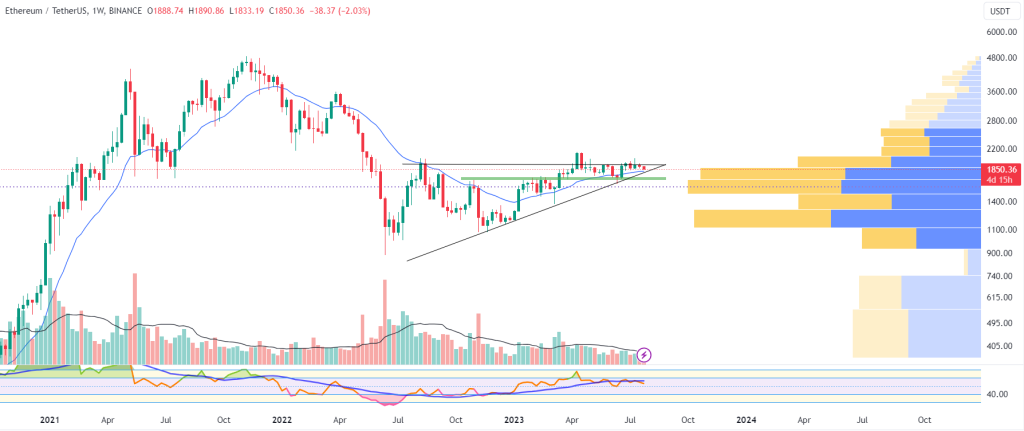
ETH once again hit the lower boundary of the Ascending Triangle on the Daily timeframe chart, but for the moment is not showing signs of strength. The trading range is narrowing and the spikes are getting smaller which usually suggests a big impulse move in the short-term. For the moment, however, it is difficult to predict the direction.
Things look slightly better on the higher timeframe where the price is still supported by the fast EMA and is above the local most actively traded zone as per VPVR. Below, $1,670 is a significant support level historically speaking.
The cryptocurrency market continues to be in no man’s land after the sudden selloff early this week with BTC hovering below the short-term daily range since Monday.
Economic data, FOMC
The week ahead is packed with economic data coming from the leading economies. The risk assets markets like stocks and crypto, as always, are looking forward to the Federal Open Market Committee (FOMC) meeting today with the greatest anticipation. The leading analysts expect the Federal funding rate to be further increased by 25 bps to 5.5 percent. The crypto market by default trades in range prior to FOMC meetings then turns volatile in the minutes before and after the event.
A more hawkish stance from the Committee and a hike above 25 basis points will most probably result in a short-term selloff. On July 27 we have Main Refinancing Rate decision from the European Central bank and Unemployment Claims in the United States. The EUR rate is expected to rise by 25bps to 4.25 percent while the US market participants will be looking at a potential jump in the Unemployment Claims to 234k.
Finally, on Friday we expect to hear the Bank of Japan Economic Outlook report + Monetary Policy Statement from the Asian country.
US Markets, SPX, DXY
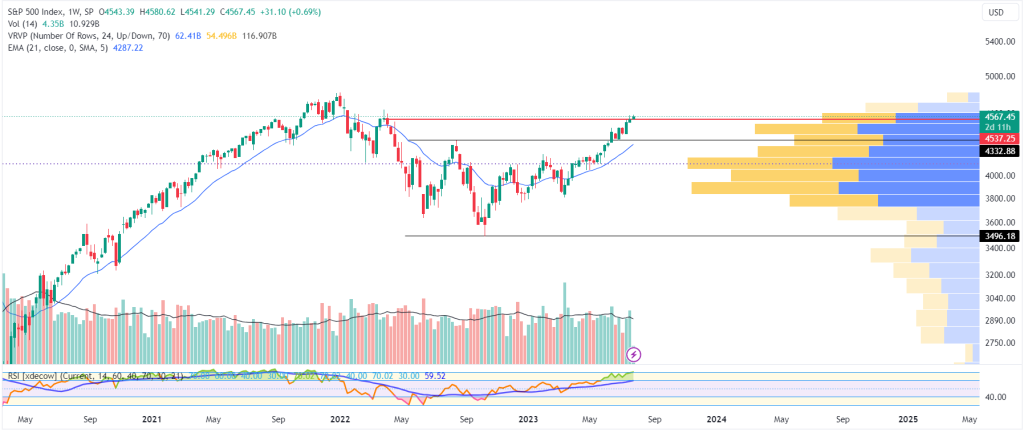
Looking at the already overextended bullish rally in the US stock market, the majority of the analysts are already pointing to some kind of a pullback, at least in the form of a consolidation that will server as a basis to form a new higher low on the weekly chart. The SPX continues to be in a resistance area above $4,550 and with an extremely overbought Relative Strenght Index (RSI).
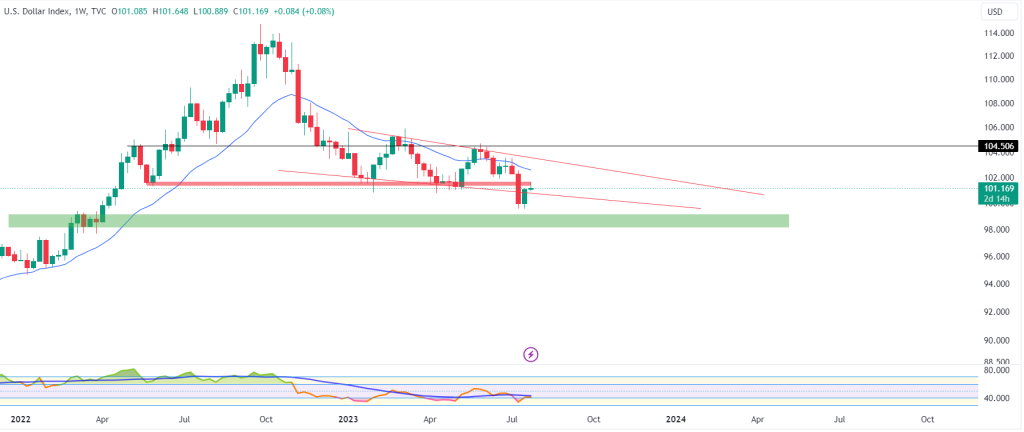
As always, the main driver here is the continuing decrease of the US dollar index DXY. The traditional safe haven asset is losing ground, which further pushes the stock market up as investors are searching for returns.
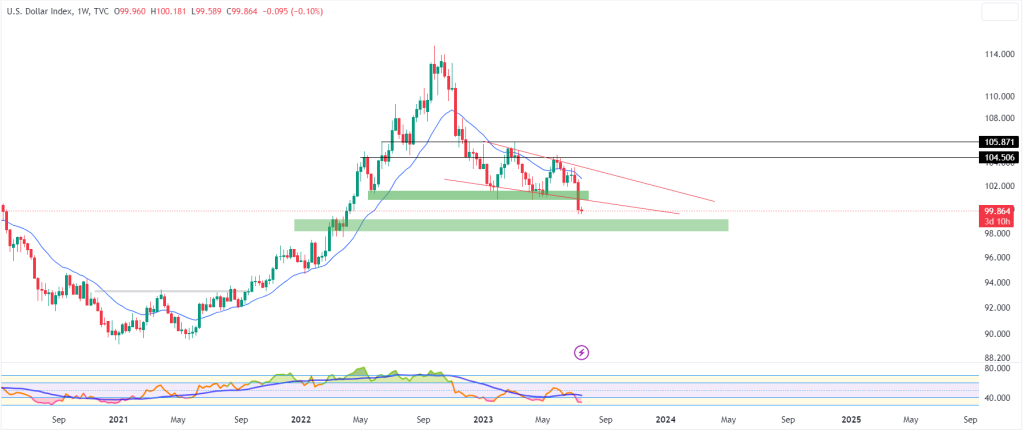
As we previously discussed, the US currency broke below the long-standing $100 support and is now testing it from below. If the mentioned line turns into resistance, it might result in a reversal to the downside and a continuation of the general downtrend.
BTC, ETH
Both BTC and ETH are still trading above their 21-EMAs on the weekly chart. BTC is out of the daily range, but with the potential to make another higher low on the weekly chart. It is without saying that the lower volumes, the fact the market erased almost all gains from the XRP ruling rally and once again failed to surpass the $31.500 resistance brings more negative vibes to the short-to-midterm outlook for the market.
ETH, on the other side, was very much on its way to push its price above the upper boundary of the Ascending Triangle figure, but suffered another rejection as the trading range gets narrower and close to a point break. In general, the ETH fundamentals and its technical setup against BTC favors it over the biggest cryptocurrency in the midterm at least.
Disclaimer: All views expressed below are not to be considered a financial advice
Overview
The crypto market is in a momentary green zone, but traders continue to walk on thin ice despite the recent gains and promising industry developments, among which we can distinguish the Ripple court win over the United States SEC and the potential ETF listings in Europe and the United States.
The European Union continues to be one step ahead of the competition regarding digital asset legislation, while the Middle East countries, Hong Kong and the UK are closely following behind.
Fundamentals, though, are only one side of the coin. The other one, the more important, is the market cycles, represented by charts of all sorts.
ETHBTC
One such chart is the ETH vs BTC or ETHBTC as it is more popular on the major trading platforms:
As seen on the Weekly chart above, the ETHBTC pair, which reflects the relative price of ether vs that of bitcoin, has been locked in the same range since May, 2021.
The initial low of that range was marked early, around 0.057 – that low that was swept in June 2022 in a liquidity grab event right below the established support. It is quite possible that we see the 0.057 level re-visited in the coming weeks or months as the former demand zone will attract the price. Such an event might mark the bottom of the ether coin vs BTC.
The Falling Wedge pattern on the chart is another argument for that thesis. A breakout in the upward direction can serve as a confirmation for switching to a long ETH bias.
All that being said, it doesn’t mean BTC will experience a catastrophic decline. It means, it simply means there is a high chance it underperforms as compared to ETH during a particular period.
DeFi revival to further boost Ethereum
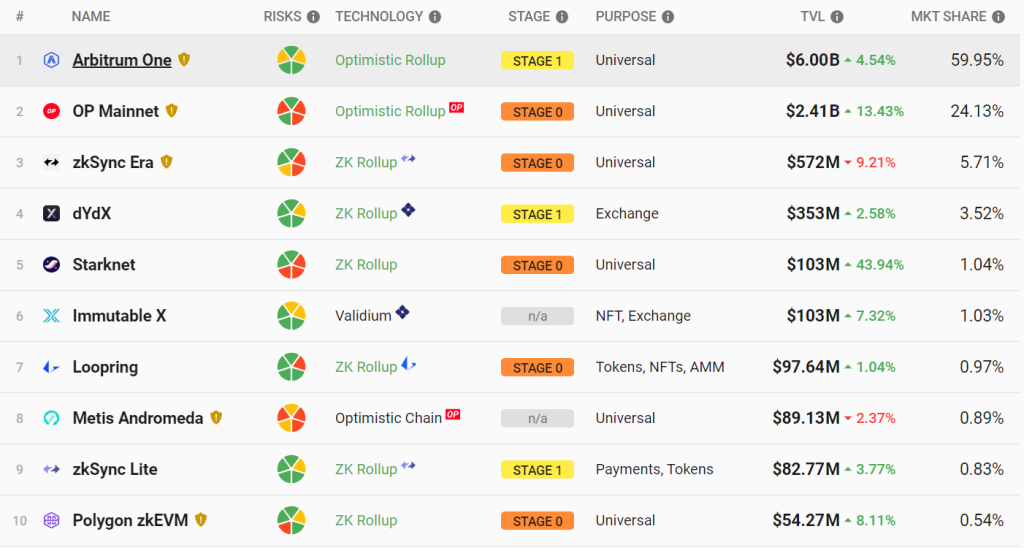
The rise of Layer 2s, the inception of Layer 3s and the growing thesis of modular blockchain structures can only benefit ETH in the long term. Yes, new data availability layers are entering the race, but in the end, Ethereum will always be part of the equation as the base security layer.
data by L2beat.com
DXY weakness – main support line lost
The weakness in the US dollar index can only benefit risk assets, be it stocks or crypto. What makes stocks much more attractive at this stage, though, is that the market doesn’t like uncertainty, and this easily results in lack of liquidity which is reflected on the charts by the much lower than the average trading volumes. The pressure from regulators, and geopolitical and economic turmoil made investors even more cautious.
But going back to DXY, it has been making lower after lower low as the market structure on the Weekly chart continues to be clearly bearish.
The index broke below the lower boundary of the Falling Wedge and lost the important 100 support. If we are to see a bearish re-test of the support line from below is yet to be seen. For now, the March 2022 order block remains the next step for traders.
The total crypto market cap rose by $7 billion in the last five days and now stands at $1,168 billion. Still below the monthly high of $1,200 billion registered few days ago.
BTC/USDT
Today is the end of month, so all eyes are on monthly candle close and all the implications it might bring given the fact the Q1 of 2023 will be ended as well. The biggest cryptocurrency is set to close above the 21-period EMA on the 1-month chart but near the May-July, 2021 lows, which might be interpreted as a resistance zone. Still, it is in a steady uptrend and a price correction that might result in a higher low might be healthy for the long-term price development. Below is the 1M chart.
Looking it from a weekly chart perspective, BTC is attempting a break into the next major resistance in the $30,000-$32,000 area. It is trading stable above all closest weekly highs and out of the former range marked by the $24,300 high. The biggest cryptocurrency is moving in a good pace towards the next major zones of interest on the chart.
Below is the 1W chart
Switching lower, to the daily timeframe, bitcoin is still showing signs of bearish divergence between the price action and the Relative Strength Index (RSI) which usually signals a change in direction of trading, but in general this indicator is used on higher timeframes. What is clear, however, is the formed range in the $28,300 – $27,000 area, which is now dictating the overall market movement.
1D chart below
ETH/USDT
When it comes to ETH, the coin is currently trading above the nearest monthly and weekly horizontal resistances. The $1,930 mark remains the closest major obstacle in sight. A series of higher highs above the 21-period EMA are signs of a healthy uptrend.
1W chart below
On the lower, 1-day chart, ether is still caught in the the tight range between $1,700 and $1,815 with the later being the current low time frame resistance point. Just like in the case of bitcoin, however, there is a bearish divergence with the RSI indicator noticeable on the chart. A break to the upside will see the coin rally up to $1,940 while a pullback might result in re-visiting the range low.
The cryptocurrency market lost approximately $45 billion during the last seven days after hitting multiple resistances across the major cryptocurrency pairs.
BTC
Bitcoin erased 5.4 percent of its market cap for the period and moved further away from the critical monthly resistance at $23,300. The 24-hour trading volumes remained above the average for the last 14 days, but the BTC/USDT pair was in a desperate need of a pullback to ensure a proper consolidation is in place.
The price is still floating above both the last weekly high and the 21-period EMA on the weekly timeframe chart. It is also worth noting that the formed mid-term diagonal resistance could start acting as support if the zone around the mentioned high ($21,200-$20,600) provides the required stability.
The huge green candle from the week of January 9 was filling the gap that was formed during the first week of November, 2022, so the price is probably not looking for imbalances to cover at this point.
On the other hand, BTC has been lacking bullish momentum lately and the market structure might not support further increase until the monthly resistance is surpassed.
United States Securities and Exchange Commission investigating Paxos, issuer of BUSD, the native stablecoin of the Binance exchange.
The majority of the altcoins are registering double-digit loses today in the aftermath of the news that the third biggest stablecoin in the world is under investigation. Paxos announced it will stop issuing BUSD which resulted in the coin losing its peg against both competitor stablecoins USDT and USDC
ETH
The biggest and most popular altcoin – ETH is also under immense pressure after suffering a rejection at its monthly resistane near $1,690. It has corrected its price by 12 percent since then and it is currently flirting with the dynamic resistance of the short 21-period EMA on the weekly timeframe. Next support will most probably be around the $1,350-$1,280 area, which has previously acted as a Point of interest and where a high volume trading was recorded.
BabyDoge, another dog meme coin has been making waves lately thanks to the continues support from Elon Musk. The Tesla founder who is an avid Doge supporter wore a Dogecoin t-shirt during last night’s SuperBowl LVII
Baby Doge rallied 18 percent up since then and is now the third largest meme coin
Last but not least:
The popular Layer 2 chains Arbitrum and Optimism continue their expansion. The two are once again the fastest growing chains on the Top 10 list on DeFi Llama for the last seven days and also on a monthly basis.