
Disclaimer: All views expressed below are not to be considered a financial advice
Overview
The crypto market is in a momentary green zone, but traders continue to walk on thin ice despite the recent gains and promising industry developments, among which we can distinguish the Ripple court win over the United States SEC and the potential ETF listings in Europe and the United States.
The European Union continues to be one step ahead of the competition regarding digital asset legislation, while the Middle East countries, Hong Kong and the UK are closely following behind.
Fundamentals, though, are only one side of the coin. The other one, the more important, is the market cycles, represented by charts of all sorts.
ETHBTC
One such chart is the ETH vs BTC or ETHBTC as it is more popular on the major trading platforms:

As seen on the Weekly chart above, the ETHBTC pair, which reflects the relative price of ether vs that of bitcoin, has been locked in the same range since May, 2021.
The initial low of that range was marked early, around 0.057 – that low that was swept in June 2022 in a liquidity grab event right below the established support. It is quite possible that we see the 0.057 level re-visited in the coming weeks or months as the former demand zone will attract the price. Such an event might mark the bottom of the ether coin vs BTC.
The Falling Wedge pattern on the chart is another argument for that thesis. A breakout in the upward direction can serve as a confirmation for switching to a long ETH bias.
All that being said, it doesn’t mean BTC will experience a catastrophic decline. It means, it simply means there is a high chance it underperforms as compared to ETH during a particular period.
DeFi revival to further boost Ethereum
The rise of Layer 2s, the inception of Layer 3s and the growing thesis of modular blockchain structures can only benefit ETH in the long term. Yes, new data availability layers are entering the race, but in the end, Ethereum will always be part of the equation as the base security layer.
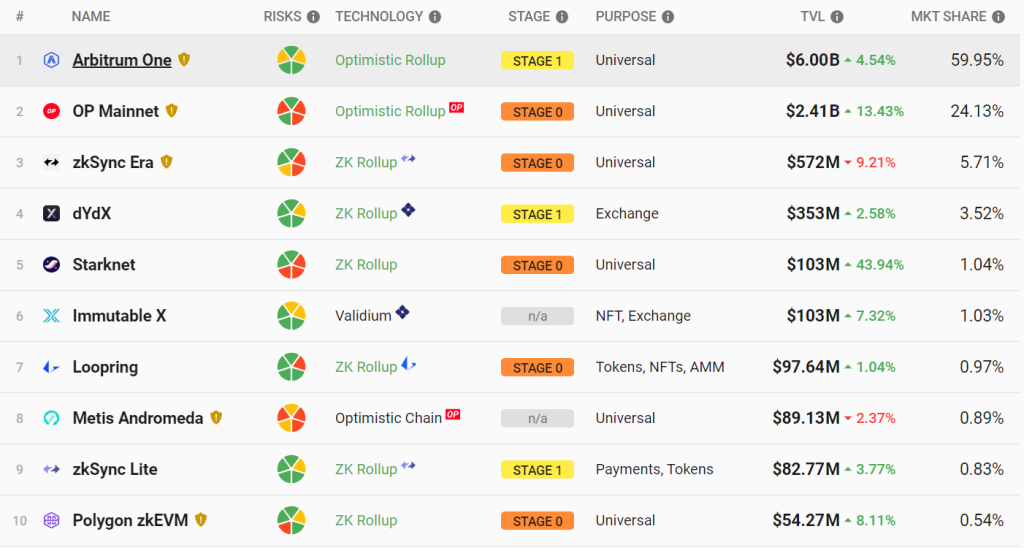
data by L2beat.com
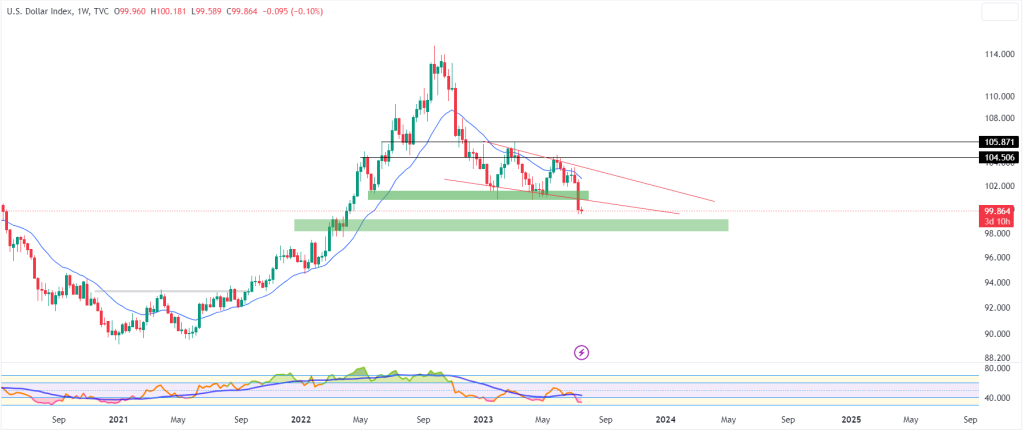
DXY weakness – main support line lost
The weakness in the US dollar index can only benefit risk assets, be it stocks or crypto.
What makes stocks much more attractive at this stage, though, is that the market doesn’t like uncertainty, and this easily results in lack of liquidity which is reflected on the charts by the much lower than the average trading volumes.
The pressure from regulators, and geopolitical and economic turmoil made investors even more cautious.
But going back to DXY, it has been making lower after lower low as the market structure on the Weekly chart continues to be clearly bearish.
The index broke below the lower boundary of the Falling Wedge and lost the important 100 support.
If we are to see a bearish re-test of the support line from below is yet to be seen. For now, the March 2022 order block remains the next step for traders.
Keep watching Fintech Express for more stock and crypto market insights.