DeFi under attack (again)
Curve protocol was exploited on Sunday evenin putting at risk between $50 and $100 million of user funds locked in various stablepools (alETH/msETH/pETH) using Vyper 0.2.15. The reason is thought to be a malfunctioning reentrancy lock
The exploit resulted in a sharp drop in the Total Value Locked (TVL) across multiple DeFi protocols mainly Curve which registered a 48 percent decline on a weekly basis. AAVE and Convex were also severely affected as users decided to temporarily step away from using their services.
As for CRV itself, it revisited its range low versus USDT last night European time before bouncing back up from the support area. As discussed few weeks ago, it is usually when swing buyers are entering.
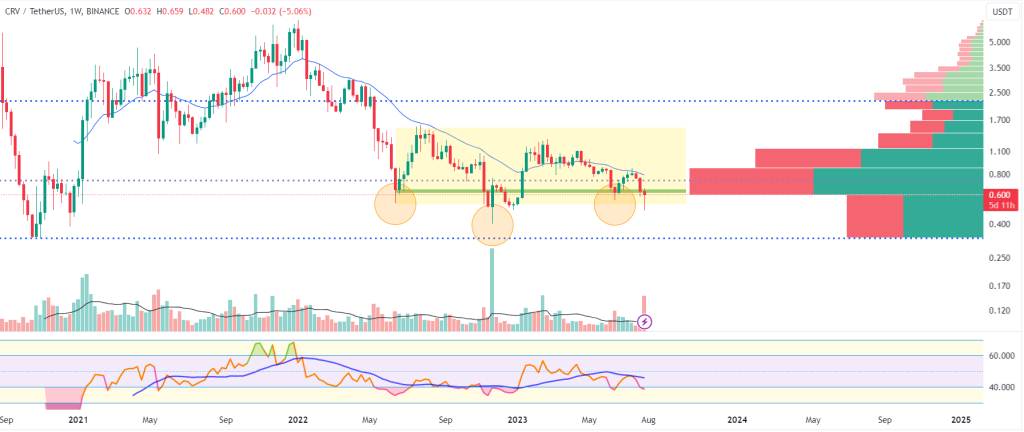
The formed low was once swept then touched briefly before the price reversed aggressively. It is also visible how the Volume Profile indicator’s most actively traded zone on the 1-week chart is right around the demand area. Buyers are prevailing there.
The RSI indicator is entering the oversold area.
Looking from the other perspective though, we can clearly see a Lower High after Lower High being built on the screen and right below the 21-EMA on the Weekly timeframe.
BTC’s disappointing performance recently does not favor an altcoin market rally.
BTC and ETH dissapoint
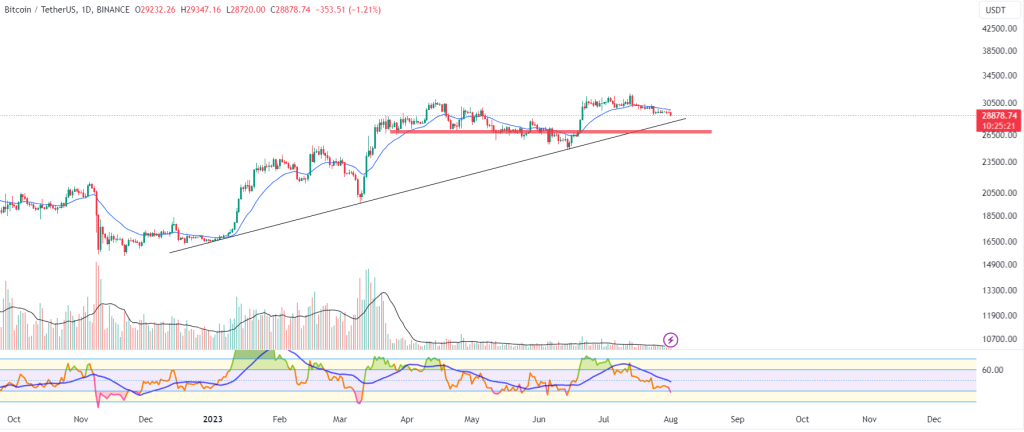
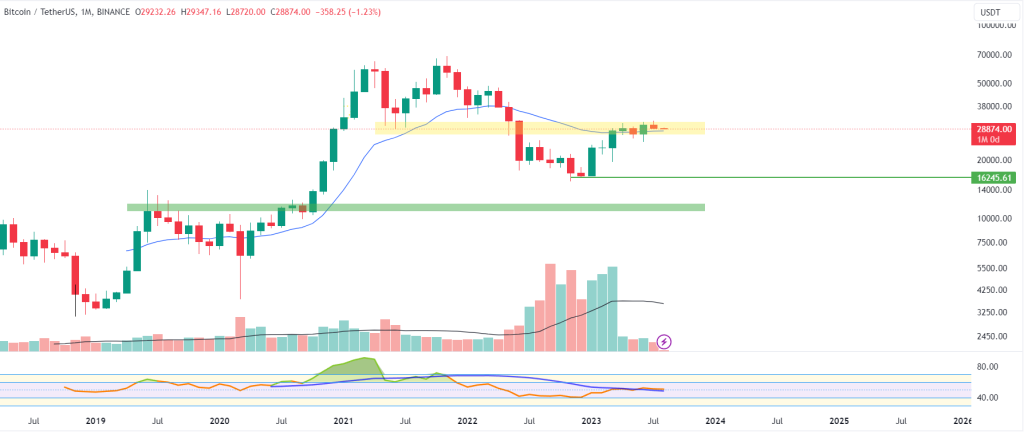
Bitcoin bulls finally gave up the fight to regain positions in the former $29,500 – $31,500 range and we can see the price slipping towards either the daily chart uptrend diagonal or the formed support/resistance area formed around the $27,000- 27,200 mark. The area was acting as a magnet for the BTC price in the March-June period.
Zooming out to the Weekly timeframe chart, the most probably zone of support for bulls might be situated somewhere between $25,000 (former weekly highs) and $20,000. The long-term diagonal support line is crucial in defending the bulls’ dreams for an UP ONLY season.
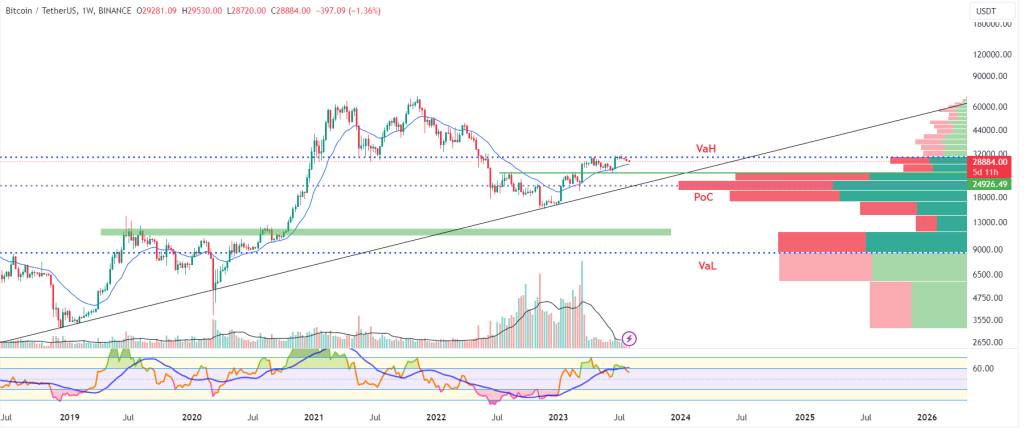
The monthly close and the price action on the 1M timeframe does not tell us much. What is clear is that there is a narrow range being formed above the fast EMA while BTC is still not giving up the formed $27,000 low.
The clear fact, though, is that overall liquidity in the market is low and every significant event is hitting particularly bad the altcoin market while BTC remains relatively stable.
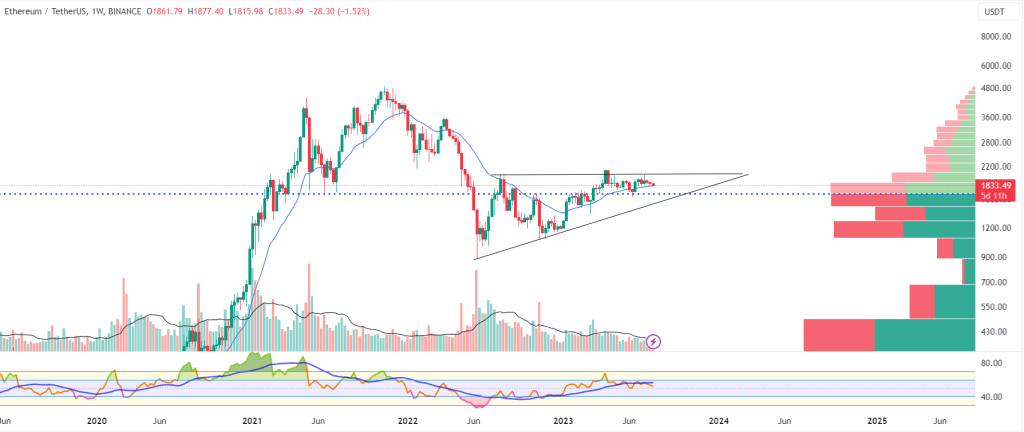
ETH
ETH once again hit the lower boundary of the Ascending Triangle on the Daily timeframe chart, but for the moment is not showing signs of strength. The trading range is narrowing and the spikes are getting smaller which usually suggests a big impulse move in the short-term. For the moment, however, it is difficult to predict the direction.
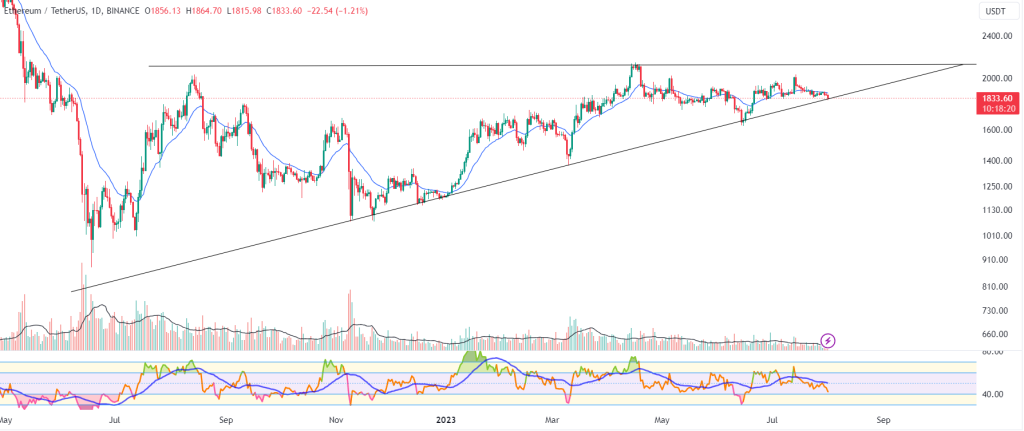
Things look slightly better on the higher timeframe where the price is still supported by the fast EMA and is above the local most actively traded zone as per VPVR.
Below, $1,670 is a significant support level historically speaking.