The crypto market has crashed following a high-value civil lawsuit by the U.S. SEC against Binance.US and CEO Changpeng Zhao.
Binance has seen $700M withdrawals happen in the time, while Coinbase’s stocks have fallen by over 10%
The total crypto market cap has fallen 3.6% to $1.09T in the past 24 hours.
A crypto crash occurs: Binance withdrawals top $700M, Coinbase stock falls 10%, total marketcap falls 3.6%
The Binance lawsuit has triggered a crypto crash, significantly decreasing major cryptos prices. At the moment of writing, Coinbase Stocks were down by 10%, while Binance had suffered a $700M+ in outflows. The total market cap of the crypto market had also fallen by a notable 3.6%
The U.S. SEC has sued Binance.US and its founder Changpeng Zhao under allegations that it operates as an unregistered securities exchange in the country. The lawsuit also outlines that Binance had been aware of the laws it was breaking but completely disregarded the authorities and carried ahead with the operations, citing a quote by its compliance officer in 2018 that they are knowingly running an unregulated securities exchange.
Today we charged Binance Holdings Ltd. (Binance); U.S.-based affiliate, BAM Trading Services Inc., which, together with Binance, operates https://t.co/swcxioZKVP; and their founder, Changpeng Zhao, with a variety of securities law violations.https://t.co/H1wgGgR5irpic.twitter.com/IWTb7Et86H
— U.S. Securities and Exchange Commission (@SECGov) June 5, 2023
The markets reacted wildly to this information, with Binance international branch seeing outflows of $700M+ in 24 hours. Conversely, Binance.US also saw an uptick in withdrawals, recording $230M+ in 24 hours.
The complaint by the SEC argues that Binance’s BNB token, Solana (SOL), Cardano (ADA), Polygon (MATIC), Coti (COTI) and Algorand blockchains (ALGO), Filecoin network (FIL), Cosmos hub (ATOM), Sandbox platform (SAND), Axie infinity (AXS) and Decentraland (MANA) are securities.
As such, their values plummeted as the market digested the news. Metaverse coins SAND and MANA had the most significant declines, with SAND collapsing by 13% to $0.52 and MANA following closely with an 11.6% decline to $0.45. Keep watching Fintech Express to get updates on the next crypto crash and other Fintech-related developments.
A Bitcoin price crash is happening with its marketcap receding from yesterday’s 542.46B to 536.97 B. This drop is off 1.01% from yesterday and -4.24% from a year ago.
Bitcoin market cap
The total Bitcoin marketcap as recorded on May 30, 2023, (536.97B) is down by 1.01% from the value recorded the previous day. This drop can be attributed to the continuous fall in crypto prices throughout May 2023. The coin’s market cap on May 04, 2023, was around 565.10B, 28.13B more than the values recorded today.
Bitcoin Price
Though Bitcoin’s market cap is down today, its price has not moved by much, it has recorded a 0.25% drop in the past 24 hours. It also has a price rise of 1.96% in the past seven days and a 24-hour transaction volume of around 451K BTC worth $12.564B.
However, this trading volume is a drop of 23.01% from what was recorded 24 hours ago pushing the coin’s market dominance to 46.53%.
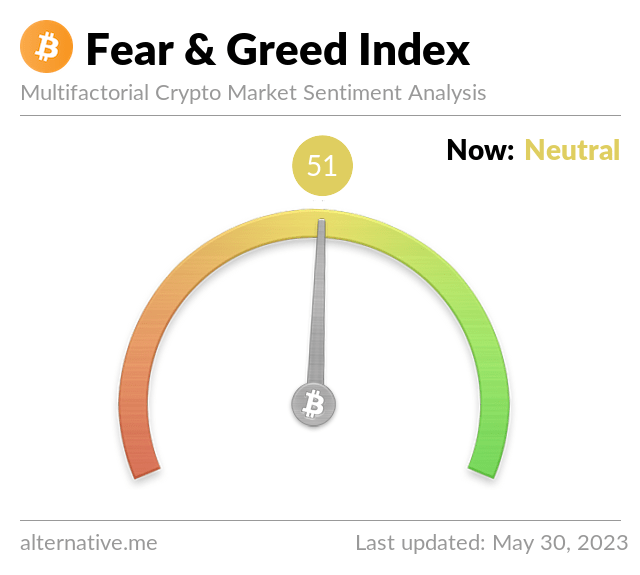
Bitcoin’s Fear and greed index
Crypto Fear and Greed index is a chart that uses social signals and market trends to determine the overall sentiment surrounding an asset in the crypto market. It’s called an index because it tracks multiple data sources and combines them to come up with a final figure that is representative of the whole market.
During the time of writing, Bitcoin’s Fear and Greed Index was at 51, neutral. That means both bears and bulls have almost equivalent power to push the price foreshadowing a sideways market in the short term (next hours of the day).
The total crypto market cap rose by $7 billion in the last five days and now stands at $1,168 billion. Still below the monthly high of $1,200 billion registered few days ago.
BTC/USDT
Today is the end of month, so all eyes are on monthly candle close and all the implications it might bring given the fact the Q1 of 2023 will be ended as well. The biggest cryptocurrency is set to close above the 21-period EMA on the 1-month chart but near the May-July, 2021 lows, which might be interpreted as a resistance zone. Still, it is in a steady uptrend and a price correction that might result in a higher low might be healthy for the long-term price development. Below is the 1M chart.
Looking it from a weekly chart perspective, BTC is attempting a break into the next major resistance in the $30,000-$32,000 area. It is trading stable above all closest weekly highs and out of the former range marked by the $24,300 high. The biggest cryptocurrency is moving in a good pace towards the next major zones of interest on the chart.
Below is the 1W chart
Switching lower, to the daily timeframe, bitcoin is still showing signs of bearish divergence between the price action and the Relative Strength Index (RSI) which usually signals a change in direction of trading, but in general this indicator is used on higher timeframes. What is clear, however, is the formed range in the $28,300 – $27,000 area, which is now dictating the overall market movement.
1D chart below
ETH/USDT
When it comes to ETH, the coin is currently trading above the nearest monthly and weekly horizontal resistances. The $1,930 mark remains the closest major obstacle in sight. A series of higher highs above the 21-period EMA are signs of a healthy uptrend.
1W chart below
On the lower, 1-day chart, ether is still caught in the the tight range between $1,700 and $1,815 with the later being the current low time frame resistance point. Just like in the case of bitcoin, however, there is a bearish divergence with the RSI indicator noticeable on the chart. A break to the upside will see the coin rally up to $1,940 while a pullback might result in re-visiting the range low.
The cryptocurrency market lost approximately $45 billion during the last seven days after hitting multiple resistances across the major cryptocurrency pairs.
BTC
Bitcoin erased 5.4 percent of its market cap for the period and moved further away from the critical monthly resistance at $23,300. The 24-hour trading volumes remained above the average for the last 14 days, but the BTC/USDT pair was in a desperate need of a pullback to ensure a proper consolidation is in place.
The price is still floating above both the last weekly high and the 21-period EMA on the weekly timeframe chart. It is also worth noting that the formed mid-term diagonal resistance could start acting as support if the zone around the mentioned high ($21,200-$20,600) provides the required stability.
The huge green candle from the week of January 9 was filling the gap that was formed during the first week of November, 2022, so the price is probably not looking for imbalances to cover at this point.
On the other hand, BTC has been lacking bullish momentum lately and the market structure might not support further increase until the monthly resistance is surpassed.
United States Securities and Exchange Commission investigating Paxos, issuer of BUSD, the native stablecoin of the Binance exchange.
The majority of the altcoins are registering double-digit loses today in the aftermath of the news that the third biggest stablecoin in the world is under investigation. Paxos announced it will stop issuing BUSD which resulted in the coin losing its peg against both competitor stablecoins USDT and USDC
ETH
The biggest and most popular altcoin – ETH is also under immense pressure after suffering a rejection at its monthly resistane near $1,690. It has corrected its price by 12 percent since then and it is currently flirting with the dynamic resistance of the short 21-period EMA on the weekly timeframe. Next support will most probably be around the $1,350-$1,280 area, which has previously acted as a Point of interest and where a high volume trading was recorded.
BabyDoge, another dog meme coin has been making waves lately thanks to the continues support from Elon Musk. The Tesla founder who is an avid Doge supporter wore a Dogecoin t-shirt during last night’s SuperBowl LVII
Baby Doge rallied 18 percent up since then and is now the third largest meme coin
Last but not least:
The popular Layer 2 chains Arbitrum and Optimism continue their expansion. The two are once again the fastest growing chains on the Top 10 list on DeFi Llama for the last seven days and also on a monthly basis.