
Key Points
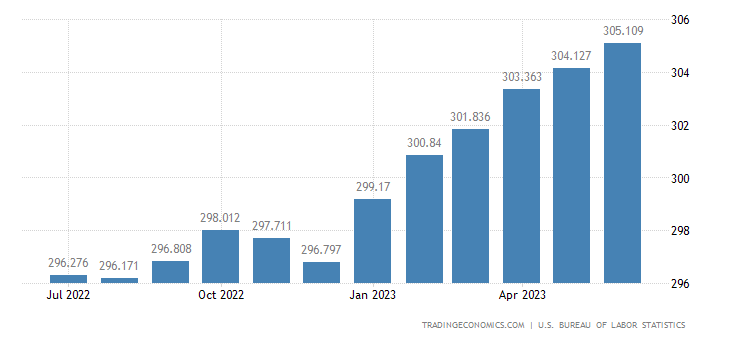
- US CPI has risen to 305.11 points in June from 304.13 points in May, but the country’s inflation rate stands at 3%.
- The consumer price index for all urban consumers (CPI-U) rose 0.2% in June on a seasonally adjusted basis.
- Over the last 12 months, all items index increased 3.0% before seasonal adjustment.
The US CPI has risen to 305.11 points in June from 304.13 points in May. Over the last 12 months, all items index increased 3.0% before seasonal adjustment. The index for shelter was the largest contributor to the monthly all-items increase, accounting for over 70 percent of the increase.
More fear in the markets as CPI increases in the US
The US Consumer Price Index (CPI) is a measure of the average change over time in the prices paid by urban consumers for a market basket of consumer goods and services. In June, it rose to 305.109 points after the Federal Reserve skipped a rates hike for the first time in months.
According to data from the Bureau of Labor Statistics, the index for shelter was the largest contributor to the monthly all-items increase, accounting for over 70 percent of the increase, with the index for motor vehicle insurance also contributing. The food index increased 0.1 percent in June after increasing 0.2 percent the previous month. The index for food at home was unchanged over the month, while the index for food away from home rose 0.4 percent in June. The energy index rose 0.6 percent in June as the major energy component indexes were mixed.
The index for all items less food and energy also rose in the month by 0.2%, the smallest 1-month increase in that index since August 2021. The indexes that increased in June include
- Shelter
- Motor vehicle insurance
- Apparel
- Recreation
- Personal care.
At the same time, some indexes decreased. They include:
- Airline fares,
- communications
- Used vehicles
- Household furnishing
- Operations
The report also indicated that all items index increased 3.0% in the past 12 months ending June, the smallest increase since March 2021. It also indicated that all items food and energy index rose 4.8 percent over the last 12 months. The energy index decreased 16.7 percent for the 12 months ending June, and the food index increased 5.7 percent over the last year.
Percent changes in CPI for All Urban Consumers (CPI-U): U.S. city average
| Seasonally adjusted changes from preceding month | Un-adjusted12-mos.endedJun. 2023 | |||||||
| Dec.2022 | Jan.2023 | Feb.2023 | Mar.2023 | Apr.2023 | May2023 | Jun.2023 | ||
| All items | 0.1 | 0.5 | 0.4 | 0.1 | 0.4 | 0.1 | 0.2 | 3.0 |
| Food | 0.4 | 0.5 | 0.4 | 0.0 | 0.0 | 0.2 | 0.1 | 5.7 |
| Food at home | 0.5 | 0.4 | 0.3 | -0.3 | -0.2 | 0.1 | 0.0 | 4.7 |
| Food away from home(1) | 0.4 | 0.6 | 0.6 | 0.6 | 0.4 | 0.5 | 0.4 | 7.7 |
| Energy | -3.1 | 2.0 | -0.6 | -3.5 | 0.6 | -3.6 | 0.6 | -16.7 |
| Energy commodities | -7.2 | 1.9 | 0.5 | -4.6 | 2.7 | -5.6 | 0.8 | -26.8 |
| Gasoline (all types) | -7.0 | 2.4 | 1.0 | -4.6 | 3.0 | -5.6 | 1.0 | -26.5 |
| Fuel oil(1) | -16.6 | -1.2 | -7.9 | -4.0 | -4.5 | -7.7 | -0.4 | -36.6 |
| Energy services | 1.9 | 2.1 | -1.7 | -2.3 | -1.7 | -1.4 | 0.4 | -0.9 |
| Electricity | 1.3 | 0.5 | 0.5 | -0.7 | -0.7 | -1.0 | 0.9 | 5.4 |
| Utility (piped) gas service | 3.5 | 6.7 | -8.0 | -7.1 | -4.9 | -2.6 | -1.7 | -18.6 |
| All items less food and energy | 0.4 | 0.4 | 0.5 | 0.4 | 0.4 | 0.4 | 0.2 | 4.8 |
| Commodities less food and energy commodities | -0.1 | 0.1 | 0.0 | 0.2 | 0.6 | 0.6 | -0.1 | 1.3 |
| New vehicles | 0.6 | 0.2 | 0.2 | 0.4 | -0.2 | -0.1 | 0.0 | 4.1 |
| Used cars and trucks | -2.0 | -1.9 | -2.8 | -0.9 | 4.4 | 4.4 | -0.5 | -5.2 |
| Apparel | 0.2 | 0.8 | 0.8 | 0.3 | 0.3 | 0.3 | 0.3 | 3.1 |
| Medical care commodities(1) | 0.1 | 1.1 | 0.1 | 0.6 | 0.5 | 0.6 | 0.2 | 4.2 |
| Services less energy services | 0.6 | 0.5 | 0.6 | 0.4 | 0.4 | 0.4 | 0.3 | 6.2 |
| Shelter | 0.8 | 0.7 | 0.8 | 0.6 | 0.4 | 0.6 | 0.4 | 7.8 |
| Transportation services | 0.6 | 0.9 | 1.1 | 1.4 | -0.2 | 0.8 | 0.1 | 8.2 |
| Medical care services | 0.3 | -0.7 | -0.7 | -0.5 | -0.1 | -0.1 | 0.0 | -0.8 |
| Footnotes (1) Not seasonally adjusted. | ||||||||
Keep watching Fintech Express for more updates on this and other fintech-related developments.